
 European Water Archive
 Satellite derived snow
 Uncertainty in flood frequency
Flood frequency computation within the uncertainty framework
Recent research
Continuous simulation in hourly time step is used for the flood frequency computation (a stochastic precipitation and temperature simulator is used as input). First, short simulations are computed, i.e. the length of the simulations is the same as the length of the observed peak series, series from which the flow duration curve or the frequency of maximum snow water equivalent have been computed.
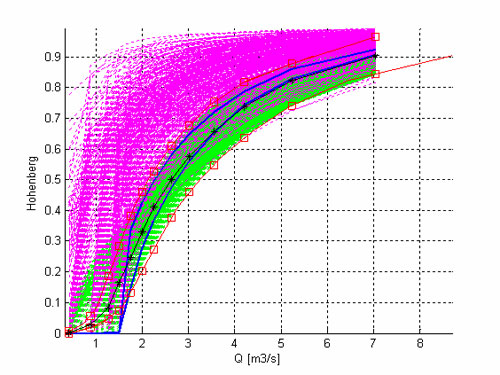
Uncertainty of the simulations plotted in the flow duration curve (black with asterics) with observation bounds (red with squares). Green - behavioural simulations on quantiles 5 to 13 (from the bottom of the curves), magenta – simulations found behavioural on flood frequency curve, blue – simulations which fulfil both criteria. Site: Hohenberg on Eger. Data: Landesamt für Wasserwirtschaft München, Ohre River Board and CHMI.
For the constraining effective observation bounds on flows computed from rating curve data are used. The graphs shows that simulations found behavioural in the flood frequency curve do not necessarily fulfil the criteria in the flow duration curve.
Each model (set of parameters) is assessed as to whether the results are within the specified limits of acceptability on the following measures:
- four selected plotting positions (at approximately ev1 reduced variate = -1, 0.37, 1.5 and 2 to 2.25) in four subcatchments
- nine quantiles of flow duration curve in two subcatchments;
- the median (2 years return period) of maximum annual snow water equivalent in 13 snow zones;
- percentage of annual floods occurring in winter in 6 subcatchments.
It gives altogether 114 criteria. Since we have found only 39 behavioural models we decided to relax the criteria in order to get more models so that we would be able to compute prediction limits. This requires putting the different evaluation measures on a common scale. This is easily achieved by treating each evaluation in terms of a normalised score that has the value -1 at the lower limit, 0 at the observed value and +1 at the upper limit. Values outside the pre-defined limits of acceptability will have normalised score values either less than -1 or greater than +1. The critical score of a simulation is the largest absolute value of the score from all the 114 limits of acceptability. The scaled limits can then be increased together so long till we get a required number of models, i.e. the minimisation is treated as a Pareto set problem. Detailed description of the study can be found in Blazkova, S. and Beven, K. (2009). This study will be used as a baseline for global change within the WATCH project of the 6th framework of EU. With the data sets of behavioural simulations 100 thousand years simulations will be computed to get reasonable estimate of 10 thousand years flood (Blazkova and Beven).

|
© 2016 EURO-FRIEND
|
Top 
|


River Trent, Nottingham, UK

Heavy rain, Penang, Malaysia